Three Boards, One Wire Protocol, and a Week of Learning to Doubt My Own Evidence
How a motor-control HIL rig’s UART chain went from “nothing works” to a fully verified 3-device relay — and what each dead end actually taught along the way.
There’s a particular kind of embedded debugging session where every individual check comes back clean, and yet the system stays completely silent. This is the story of one of those — stretched across three separate boards, two build systems, a debugger juggling two simultaneous targets, and at least three moments where the evidence in front of us was actively lying, for reasons that had nothing to do with the bug we thought we were chasing.
The system
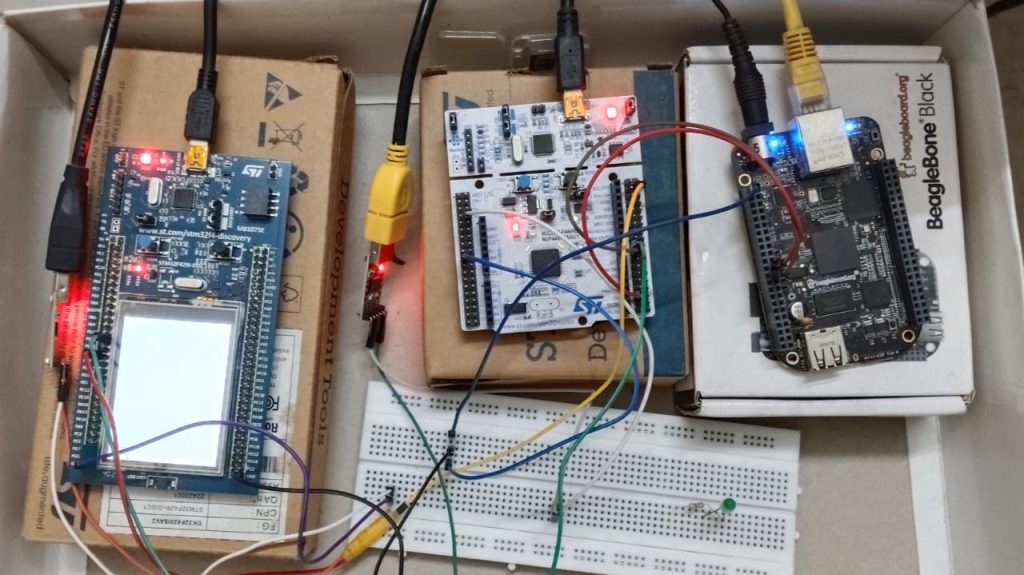
The rig exists to validate motor protection logic on a Siemens S7-300 PLC, using three devices chained together over UART:
- BeagleBone Black — runs the motor simulation and a web dashboard, talks through S7 COM to the PLC.
- Nucleo-F446RE — a UART bridge sitting in the middle, relaying frames between BeagleBone and the third board.
- STM32F429I-DISC1 — originally documented as a passive “sensor node,” but corrected to its real role partway through this project: a fault injection engine that computes realistic overload, phase-loss, thermal, and short-circuit dynamics to actually exercise the PLC’s protection logic, rather than just reporting that everything is fine.
All three talk the same 8-byte framed protocol — [0x55][device_id][msg_type][data_lo][data_hi][checksum][reserved][reserved] — at 115200 baud, 8N1, no flow control. F446RE’s job is purely mechanical: receive on one UART, figure out where the frame is addressed, forward it out the other UART (or answer locally), and relay whatever comes back.
Getting a single link working turned out to be one debugging session. Getting all three devices working together turned out to be a second, harder one — because the second time, the false leads were subtler.
Part 1 — Getting two boards to even build, then talk
The projects didn’t compile
Before any wire-level debugging could start, both STM32 projects failed to build at all — multiple-definition linker errors for huart1/huart6, multiple definitions of the IRQ handlers, and an undefined SystemClock_Config. The cause on both boards was identical: a hand-written UART implementation, complete with its own handle declarations, its own raw IRQHandler overrides, and its own main(), had been pasted directly into CubeMX-generated projects — colliding with everything CubeMX had already generated in usart.c, stm32f4xx_it.c, and main.c.
The fix was to stop fighting CubeMX’s structure: extern the handles CubeMX already owns instead of redeclaring them, and never override an IRQHandler — instead arm reception with HAL_UART_Receive_IT() and let the weak HAL_UART_RxCpltCallback() / HAL_UART_ErrorCallback() functions do the work, since defining them anywhere in the project overrides the no-op defaults automatically. Both boards built cleanly after the custom logic moved into its own files (bridge.c on F446RE, f429i_responder.c on F429I).
The protocol itself was wrong
While fixing F429I’s build, a second, more interesting problem surfaced: the existing firmware only knew how to answer mock sensor readings — the old “Sensor Node” understanding of the board. But that understanding had already been corrected on paper: F429I’s actual job was fault injection, not fake telemetry. The two roles needed to coexist without their command codes colliding, which meant msg_type had to become a category selector (SENSOR_READ, SENSOR_RESPONSE, FAULT_INJECT, FAULT_DATA, FAULT_STOP) instead of a literal command byte. Fault ramps were implemented to spec — overload climbing from 32.5A to 260A over ~6 seconds, an instantaneous short-circuit spike to 390A, a thermal ramp from 25°C to 90°C at 2°C/second, an instantaneous phase-loss voltage drop — and documented directly in the header as the contract BeagleBone’s sender code would eventually need to match.
“I don’t get any response in Tera Term”
With both boards building and running the corrected protocol, the first real communication test between F446RE and F429I produced exactly nothing. What followed was a long, methodical elimination of everything except the actual cause:
Wiring topology turned out to have both test adapters wired listen-only at first (no way to inject a command at all). The protocol needed raw binary frames sent via Tera Term’s Binary file-send, not typed text. Pin assignment (PG9/PG14 for USART6 RX/TX) checked out against the firmware. Ground reference and TX/RX orientation checked out. A loopback test — jumpering the adapter’s own TX to its own RX, bypassing the STM32 entirely — proved the adapter, COM port, and baud settings were all fine. NVIC and interrupt routing in usart.c/stm32f4xx_it.c checked out. A genuine bug did turn up in main.c (F429I_Responder_Init() was being called every loop iteration instead of F429I_Responder_Update()) and got fixed, along with a defensive stuck-RX watchdog added for good measure. None of it changed anything.
Diagnostic LEDs went in next — a distinct flicker pattern inside HAL_UART_RxCpltCallback, a different one inside HAL_UART_ErrorCallback — to answer a narrower question than “does it work”: does the chip even notice bytes arriving? Neither pattern ever appeared, across two different physical wiring locations. Two independent wirings producing the identical null result was itself a clue: it argued against “bad connection” and toward something systemic.
The blind spot: an empty error handler
The debugger came in next, with breakpoints in both HAL callbacks. Neither hit — and a static register read on USART6->SR came back “Error reading value,” a sign the core was running freely rather than halted, which meant the “breakpoints never hit” result needed independent validation before it could be trusted. A sanity-check breakpoint on something unrelated and constantly executing (HAL_Delay(100) in the main loop) confirmed the debug session itself was healthy. A multimeter on the RX pin showed a clean 3.3V idle level. Everything checked out. And still, silence.
The actual breakthrough was Error_Handler():
void Error_Handler(void)
{
  /* USER CODE BEGIN Error_Handler_Debug */
  /* USER CODE END Error_Handler_Debug */
}
CubeMX generates this for every project, called whenever a HAL init function fails. It’s empty by default, and it had never been filled in — which meant every possible initialization failure in the entire firmware was invisible by design. A breakpoint placed inside the function body (not at one specific call site — inside, so it would catch every caller) caught SystemClock_Config() calling it, because HAL_RCC_OscConfig() was failing. Execution just… continued past the failure, ran the rest of boot normally, and the LED blinked at what looked like a perfectly reasonable rate the entire time. SystemCoreClock read 16000000 — the chip’s internal fallback oscillator — instead of the intended 168MHz from an external crystal. The external oscillator genuinely wasn’t locking, in either bypass or crystal mode.
The fix was to stop depending on the external crystal entirely: SystemClock_Config() was rewritten to derive 168MHz from the internal 16MHz HSI oscillator instead (PLLM=8, PLLN=168, PLLP=÷2, PLLQ=7, Voltage Scale 1, Flash Latency 5 — plus a second latent bug, an APB1 divider that would have exceeded its clock ceiling at 168MHz regardless of what HSE did). The very next test after the fix, HAL_UART_RxCpltCallback fired for the first time in the entire session. A real reply appeared in Tera Term, repeatably.
Part 2 — Adding BeagleBone, and learning to doubt the evidence again
With F446RE and F429I talking cleanly, the next milestone was the real thing: BeagleBone driving the link over its own UART1, through F446RE, to F429I and back. This is where a second debugging session started — shorter than the first, but with sharper traps, because this time the false signals looked exactly like success.
Round trip zero: total silence, again
BeagleBone was wired to F446RE’s USART1 (P9_24 TXD → PA10, P9_26 RXD ← PA9, shared ground), config-pin set both header pins to UART mode, and a fresh Python client script sent the same style of test frames that had worked over direct adapters. Every single request timed out — including the simplest possible one, a local status check that never even involves F429I.
That last detail mattered: when the simplest request fails identically to the complex ones, the problem is almost never in application-level protocol logic. It’s transport.
First false lead: the debugger itself
Because F446RE had just come out of a debugging session (halted mid-breakpoint from checking its own clock configuration — a check that, this time, came back clean at 84MHz, no bug there), the very first suspect was: is the board actually running? A halted core can’t service any interrupt, UART or otherwise, and would produce exactly this symptom. It wasn’t the cause here, but it was cheap to check and worth ruling out before touching a screwdriver.
Second false lead: bus contention
A USB-TTL adapter, left wired onto the same USART1 pins as BeagleBone from an earlier isolated test, was still connected — two active transmitters driving the same receive line. Removing it didn’t fix the timeout, but it removed a genuine confound that would have made anything downstream harder to reason about.
The real bug: half the NVIC configuration was simply missing
A side-by-side read of usart.c‘s HAL_UART_MspInit() function found it. The USART6 branch (F429I-facing, the half that worked) explicitly enabled its interrupt:
HAL_NVIC_SetPriority(USART6_IRQn, 0, 0);
HAL_NVIC_EnableIRQ(USART6_IRQn);
The USART1 branch (BeagleBone-facing) had GPIO configuration and nothing else. No NVIC enable at all. The peripheral could receive bytes and set its own internal RXNE flag just fine — but the Cortex-M4’s NVIC never routed that event to the CPU, so USART1_IRQHandler() never fired, HAL_UART_RxCpltCallback() never ran, and Bridge_Init()‘s armed HAL_UART_Receive_IT() call just sat there forever, silently. This traced back to CubeMX’s .ioc file: USART6’s “global interrupt” checkbox was checked in the NVIC settings; USART1’s wasn’t. One unchecked box, and an entire link went dark while looking, from the source code’s perspective, almost identical to its working sibling.
Checking that box, regenerating, and rebuilding surfaced the next trap.
Third false lead: “I fixed it, why isn’t it fixed?”
Regenerating code from an updated .ioc doesn’t rebuild the project, and building doesn’t reflash the board. Twice during this stretch, a fix that was correct in the source files produced zero change in behavior because the old binary was still what was actually running on the chip. Separately, launching via Debug (rather than Run) halts execution at main() by default — meaning even a freshly flashed, genuinely-fixed binary can sit frozen, unable to service any interrupt, if nobody presses Resume. Both of these had already bitten during the original F429I clock investigation. Both bit again here. The fix each time was mechanical: rebuild, reflash, and confirm via a debugger register check — RCC->APB2ENR bit 4 set, USART1->CR1 == 0x202c (matching USART6’s known-good pattern), and NVIC->ISER[1] bit 5 set — that the running firmware, not just the source tree, actually had the fix.
The trap that looked exactly like success
With the NVIC fix confirmed live, a direct adapter test on F446RE’s USART1 pins (BeagleBone disconnected, isolating F446RE from everything else) appeared to work — Tera Term showed characters after each send. Then, after closing and reopening the terminal to clear old clutter, the same test showed nothing. Reopening again, with Local Echo now switched on “to see the response,” text reappeared.
That detail — needing to turn Local Echo on in order to see anything — was the tell, in retrospect. Local Echo mirrors your own sent bytes back to the display; it has no effect on genuinely received bytes, which always show up regardless of the setting. Needing it on to see a “reply” meant the reply wasn’t real. The confirming detail was even more precise: the test frame being sent contained the byte 0x55 twice — once as its start byte, once coincidentally as its own checksum — which prints as “UU” with Local Echo on and zero real response. That is exactly what had been showing on screen the whole time, misread as confirmation.
Turning Local Echo off and resending showed nothing at all. Back to square one — except now with a cleaner instrument and a very concrete lesson: a terminal showing something is not evidence of a reply. It’s evidence of a terminal setting.
Tracing it with a debugger, on two chips at once
The next attempt used the debugger properly — with a critical adjustment. A single breakpoint at the top of the shared HAL_UART_RxCpltCallback function is ambiguous, because the same function handles both UART1 and UART6 completions; it can fire from the wrong peripheral and look like progress. The fix was to place breakpoints deeper, on lines that only execute inside the branch already known to be USART1-specific, and to always check the call stack — specifically looking for USART1_IRQHandler versus USART6_IRQHandler as the actual caller, since a shared callback function’s identity alone doesn’t tell you which UART triggered it.
Debugging both boards simultaneously required two fully independent GDB sessions — one per board’s onboard ST-LINK probe. CubeIDE’s default debug configurations for two projects both claim the same GDB server port by default, which fails the second launch with “Failed to start GDB server” until one configuration’s port is changed. Once both sessions were live, they ran as two entirely separate trees in the Debug view, each halting and resuming independently — meaning it was trivially easy to spend several minutes clicking Resume on one board’s session while the other sat frozen at its own entry breakpoint the entire time, never having run at all. That happened. More than once.
With a genuinely correct, genuinely running fix on both boards, an adapter test finally produced an unambiguous result: the call stack showed USART1_IRQHandler as the caller, and the reply byte pattern in Tera Term (“UW” instead of the earlier false-positive “UU”) matched the actual reply frame’s content — not the sent frame’s. Two independent signals agreeing is a much higher bar than either alone, and this time they agreed.
One more relay hop nobody had actually tested
Reconnecting BeagleBone and rerunning the full test sequence produced a genuinely new, more interesting failure pattern: purely local requests (handled entirely within F446RE, never touching F429I) succeeded intermittently, while every request needing the full relay — BeagleBone → F446RE → F429I → F446RE → BeagleBone — failed consistently. That distinction mattered, because it surfaced something that had gone unnoticed for the entire project: the full four-hop relay path had never actually been exercised end-to-end before. Every prior success with F429I’s fault engine had come from a direct connection that bypassed F446RE’s relay logic entirely.
Tracing it required three breakpoints across both live debug sessions — F446RE’s relay-out call, F429I’s own receive handler, and F446RE’s relay-back call — walked through one request at a time, with a purpose-built single-shot test script using a 60-second timeout so nothing would retry or move on mid-inspection. The first full trace found the last missing piece: F429I’s session had, again, simply never been resumed past its own boot halt. Once both boards were confirmed genuinely running and the three breakpoints were walked in order, the relayed request went all the way through — and the fault engine’s periodic 100ms FAULT_DATA push, streaming continuously while the injected fault ramped, kept re-triggering the relay-back breakpoint over and over. Not a bug. Confirmation the ramp was live and streaming exactly as designed.
The payoff, with a built-in correctness check
A clean run — both debug sessions fully detached, both boards running free — put the whole chain through every message type: local status checks, a sensor read relayed through F429I, and all four fault injections. Every one succeeded, and the fault values matched the documented physics exactly: overload climbing at 3.8A per 100ms tick (on pace for 32.5A→260A over 6 seconds), phase-loss flat at 100V, thermal climbing at precisely 2°C/second, short-circuit flat at exactly 390.00A. That’s a stronger confirmation than “a reply arrived” — it’s confirmation that the ramp math inside F429I’s fault engine is correct, verified by a client that had no way to know what the “right” numbers were supposed to look like ahead of time.
The last asymmetry
One thing didn’t fit the otherwise clean run: FAULT_STOP timed out on every single fault type, 4 for 4, while everything else — including the continuous ramp data — worked. The uniformity across four otherwise very different fault behaviors (two ramping, two flat) was the tell that this wasn’t randomness. A direct read of f429i_responder.c confirmed it: handle_fault_stop() cleared the fault state and restored nominal sensor values, but was the only handler in the entire file that never called send_message() at all. Every sibling function replied — handle_sensor_read() always does, handle_fault_inject() sends an immediate acknowledgment. handle_fault_stop() just went quiet. The fix reused the exact mechanism already sitting right there: calling push_fault_value() at the end, which — now that the fault state is cleared — naturally sends back data=0, reserved[0]=FAULT_NONE, reading as “fault cleared” through the same frame shape the client already understood, with no new message type and no client changes required.
What both rounds of this, together, actually taught
Silence is not one failure mode — it’s a symptom with many causes, and they stack. Across both debugging sessions, “nothing happens” turned out to mean: a genuinely missing NVIC enable, a bus-contention short between two transmitters, a debugger holding a core halted, a stale binary that was never actually reflashed, and a terminal setting quietly fabricating false positives. All of them look identical from the outside. None of them look like each other from the inside.
A terminal, a register view, or an LED pattern is only as trustworthy as your last validation of the instrument itself. This project hit that lesson three separate times, in three different forms: a sanity-check breakpoint to validate the debugger, a byte-level analysis to catch Local Echo fabricating a reply, and a call-stack check to catch a shared callback function lying about which peripheral actually fired it.
When two nearly-identical code paths behave differently, read them side by side before assuming the bug is somewhere clever. The missing NVIC enable and the missing FAULT_STOP acknowledgment were both found the same way — not through a debugger, not through electrical measurement, but by putting the broken function’s code next to its working sibling and looking for the one thing that wasn’t there.
“I fixed it” and “the board is running the fix” are two different claims, and only a live register read proves the second one. Regeneration isn’t a rebuild. A rebuild isn’t a reflash. A reflash via Debug isn’t running, until someone presses Resume — and with two boards debugged simultaneously, it’s disturbingly easy to resume one and forget the other is still sitting frozen at its own entry point.
The deepest bug in a chain is often the hop nobody thought to test in isolation. Two boards talking directly, and BeagleBone talking to F446RE locally, both worked long before the full four-hop relay did — and it took a specific, deliberate three-breakpoint trace across two live debug sessions to notice that the full path had simply never been proven before, rather than assuming it inherited correctness from its two halves.
A protocol response is a contract, and every handler needs to honor it the same way. Four sibling functions, three of which always reply and one of which silently didn’t — found not by staring at wire traffic, but by reading the code and asking a simple question: does this function look like its neighbors?
Epilogue: one more asymmetry, and one more reminder about hardware
Fixing FAULT_STOP turned out to be the shortest part of the whole effort. A straight read of f429i_responder.c showed handle_fault_stop() clearing the fault state and restoring nominal sensor values — and never once calling send_message(), the only handler in the entire file that didn’t. Every sibling function replied; this one just went quiet. The fix reused the exact mechanism already sitting right there: call push_fault_value() at the end, same as handle_fault_inject() already did for its own instant ack. With the fault state now cleared, that naturally sends back data=0, reserved[0]=FAULT_NONE — “fault cleared,” through a frame shape the client already knew how to parse, no new message type required.
Rebuilding and reflashing F429I with that fix produced one more, smaller round of the same lesson this whole project kept teaching: right after the reflash, a full retest came back completely silent again — including the simplest possible request, one that never even reaches F429I. BeagleBone’s own pinmux was intact (its power was never cycled), no debug session was still holding a core halted, and a direct adapter test proved F446RE itself was perfectly healthy in isolation. That left exactly one explanation: a jumper wire disturbed by handling the boards while unplugging and replugging a USB cable for the reflash — nothing to do with the fix itself, everything to do with a breadboard connection near enough to get bumped. Reseating it resolved the “regression” immediately.
It’s a fitting last note for a project that spent two long debugging sessions distinguishing real bugs from the equally-real ways instruments and hardware can lie: even after every actual bug is fixed and verified, the physical world still gets one more vote.
With that resolved, a full retest confirmed every fault type now acknowledges FAULT_STOP cleanly and immediately — closing out the entire debugging effort, from the very first empty Error_Handler() all the way through to the last silent function that needed a voice.
What’s left is the part that was always going to be there from the start, independent of any of this: verifying the protocol assumptions baked into f429i_responder.h against BeagleBone’s actual production sender code, rather than the best-guess convention this whole debugging effort was built and tested against. That’s a different kind of problem — not “why is it silent,” but “are we even agreeing on what we’re saying” — and it’s next.